Excellence at the University of Washington is not accidental — it emerges from a deliberate commitment to fostering a community where diverse perspectives spark innovation, inclusion opens doors, and engagement turns potential into impact. The Office for Academic Personnel and Faculty (APF) sits at the center of this work, advancing a mission focused on engaging, elevating, and supporting academic professionals who shape the University’s state, national, and global influence. When faculty thrive, ideas flourish, and the ripple effects extend far beyond campus.
The 2025 UW Faculty Demographic Baseline Report offers a detailed, accountable look at who the University’s faculty are, who they are becoming, and where the institution has opportunities to expand access and create conditions for success. This report provides a baseline for understanding faculty composition across professorial ranks and tracks, examining race, gender, age, hiring patterns, separations, international scholars, promotion, retention, and development programs. The data reflect the October 31, 2025 census, along with supporting datasets that illuminate how the faculty workforce changes over time.
More than a collection of numbers, this report is a tool for institutional learning — a way to ask critical questions such as: Is the University attracting a full spectrum of talent? Are faculty supported in ways that allow them to succeed? What does current faculty composition signal about the discoveries and innovations UW is positioned to generate? By establishing this demographic baseline, the University strengthens its ability to track progress, identify gaps, and ensure that faculty excellence and opportunity evolve in alignment with institutional values.
Data Overview & Definitions
Provides descriptions of all datasets, census parameters, professorial tracks and ranks, and key demographic categories used to ensure consistent, comparable faculty analyses.
Data Overview & Definitions
OUR DATASETS
This report combines data from multiple sources; each source has specific parameters applied to create a baseline allowing for future comparisons and analyses.
The Office for Academic Personnel and Faculty (APF) has chosen specific areas of focus, described below. Each of the datasets represents faculty included in the following categories:
- Professor (Tenure, Without Tenure by Reason of Funding [WOT], Research, Teaching, Clinical Practice)
- Associate Professor (Tenure, WOT, Research, Teaching, Clinical Practice)
- Assistant Professor (Tenure, WOT, Research, Teaching, Clinical Practice)
These faculty categories are those whose appointments are subject to approval by the Board of Regents and are known as the professorial faculty. Professorial faculty are appointed to multi-year or indefinite terms following a competitive search and are members of the voting faculty. There are several other instructional, non-voting, annually appointed faculty titles; these are not included in the dataset presented in this report. In previous years, the professorial track Clinical – Dental Pathway (approximately 12 faculty) was also included in the professorial dataset. During 2025, all faculty in this track either retired or moved to the new clinical practice track.
A new professorial track was added in 2024-25, that of Clinical Practice, which recognizes the important role of practicing clinicians in the University’s educational mission. Over the past year, approximately 200 faculty previously in annual, non-voting, clinical titles transferred into the multi-year professorial clinical practice track after documentation of a competitive search and of the qualifications outlined in Faculty Code Section 24-34.B.6. Approximately 15 faculty in professorial titles (primarily teaching track or the special pathway in dentistry) also moved into the new clinical practice track. New hires are also occurring in this track, with 245 faculty in this track as of the October 31 census.
DATASET 1: CURRENT FACULTY CENSUS
The census datasets represent a snapshot as of October 31 for the given year and include positions meeting the criteria identified above. The demographic data associated with these faculty are self-reported. The data were collected during the onboarding/appointment process and can be updated within our human capital management system (Workday) by faculty at any time during employment. Providing or declining to provide this information has no adverse impact on the individual. The census includes only primary appointments with each individual appearing only once in the dataset. The census counts all individuals who have a continuing appointment independent of whether they are permanently on a part-time basis or are currently on either professional or personal leave.
The faculty census for October 31, 2025, forms the primary source for data in this report. Figures 1 and 2 also include census data from October 31, 2020, and October 31, 2015, for comparison.
DATASET 2: NEW FACULTY HIRES AND SEPARATIONS ACROSS ALL THREE CAMPUSES
The AY 25 Hires and Separations dataset represents all faculty hires, resignations, and retirements occurring between November 1, 2024, and October 31, 2025. The dataset is obtained by comparing the annual censuses for 2024 and 2025. This report focuses on the AY 25 dataset, but the equivalent data for the previous three
years are averaged and included for comparison in Figure 5. The demographic data associated with the faculty represented in this dataset are the same as those in Dataset 1: self-reported data collected during onboarding that may be edited by the faculty member at any time during employment.
When faculty change track (e.g., from WOT to tenure, or from tenure to teaching), this change is included in the hires and separations dataset as both a resignation from the old track and a hire in the new track. Traditionally, this involves fewer than 5 people per year. However, with the creation of the new clinical practice track in AY 25, approximately 200 faculty resigned from annual clinical titles (not included in this dataset) to join the clinical practice titles (included in this dataset). Also, 15 faculty within the School of Dentistry resigned either teaching professorial or clinical-dental-pathway positions to join the clinical practice track and are thus included in both the resignation and new hires professorial datasets.
DATASET 3: DATA OUTSIDE OF THE ANNUAL CENSUS
Other data in this report are from internal records in Academic Personnel & Faculty and results of requests to deans and chancellors for information. These data are discussed with reference to the faculty hiring process, competitive and pre-emptive retention, and faculty promotion. APF is developing processes for more systematic collection and categorization of these data, as well as educational materials for the administrative staff who submit these data to
the office.
DATA VARIABILITY
Datasets are snapshots of the time when they were retrieved, and data may shift due to retroactivity in the human capital management system (Workday). Census data differ from direct downloads from Workday in that they are validated by staff within both UW Human Resources and Academic Personnel & Faculty in consultation with academic units. The annual “fallout” from the census that requires consultation with units is decreasing over time as the office improves outreach and training for unit administrative staff.
Data are based on human entry. From applicants to hiring managers and search committees, data are based on what different users entered at specific points in time and are therefore subject to bias, error, and inconsistencies.
There will continue to be changes. As faculty appointment types continue to evolve, the University may reconsider how to group or characterize represented faculty.
DEFINITIONS
PROFESSORIAL FACULTY RANKS AND TRACKS
Professorial Rank
| Assistant Professor | Faculty code: “evidences promise of a successful career” Tenure, research, and WOT tracks are “clock-managed,” with a maximum of two 3-year appointments, followed by a mandatory promotion consideration. Teaching and clinical tracks may be reappointed at rank indefinitely to 3-5 year terms. |
| Associate Professor | Faculty code: “record of substantial success” Tenure and WOT have indefinite appointments. Teaching, Research, and Clinical are term appointments |
| Professor (Full) | Faculty code: “outstanding, mature scholarship/teaching […] national or international recognition” Tenure and WOT have indefinite appointments. Teaching, Research, and Clinical are term appointments. |
Professorial Track
| Track | Term | Salary Source | Description |
|---|---|---|---|
| Tenure | Asst: Clock Managed Assoc: Indefinite Full: Indefinite |
Primarily state + tuition | Full range of research, teaching, service. Rarely clinical. |
| Teaching | Asst: 3 – 5 yrs Assoc: 3 – 7 yrs Full: 3 – 10 yrs |
Primarily state + tuition | Emphasis on teaching activities; some scholarship and service. |
| Research | Asst: Clock Managed Assoc: 3 – 7 yrs Full: 3 – 10 yrs |
Primarily grants and contracts. | Emphasis on research activities; some mentoring, and service. |
| WOT (without tenure by reason of funding) |
Asst: Clock Managed Assoc: Indefinite Full: Indefinite |
Combination of grants and clinical. State funds when appropriate | Full range of activities. Most focus on either externally-funded research or clinical activities. |
| Clinical Practice | Asst: 3 – 5 yrs Assoc: 3 – 7 yrs Full: 3 – 10 yrs |
Primarily clinical. Some grants or state when appropriate. | Emphasis on clinical activities; teaching, scholarship, and service in the clinic. |
DEMOGRAPHIC COMPOSITION
| Underrepresented Groups (URG) | Includes those individuals who self-report as American Indian or Alaska Native; Black or African American; Hispanic or Latino; Native Hawaiian or Pacific Islander. |
| Two or More Races | Includes those individuals who self-report more than one racial or ethnic category, including white, Asian, or URG. Because of small numbers, “two or more races” is often combined with URG as URG+. |
| No info | Includes those individuals who either formally declined to disclose their demographic information or did not respond. |
| Small Numbers | Fewer than 5 individuals. |
Note: For analysis purposes, faculty may be grouped by campus, by rank (Professor, Associate Professor, Assistant Professor) across all tracks, or by specific track within each rank, depending on the research question.
Due to both the large size and the unique mission of the School of Medicine (SOM), data disaggregated by campus designates Medicine as its own campus, with Seattle including all other academic units on the Seattle campus.
The term “tri-campus” refers to all UW faculty, including Bothell, Tacoma, and both the medical and non-medical units of the Seattle campus.
Faculty Demographic Analysis
Examines 2015–2025 changes in faculty composition by campus and track, highlighting shifts in tenure‑track proportions and growth in teaching and clinical practice tracks.
Faculty Demographic Analysis
10-YEAR COMPARISONS
FIGURE 1: 10-YEAR COMPARISON BY CAMPUS AND TRACK
Figure 1 shows the distribution of faculty by professorial track across the University of Washington’s Seattle, Bothell, and Tacoma campuses and the School of Medicine for the years 2015, 2020, and 2025. The titles of Lecturer, Senior Lecturer, and Principal Lecturer in 2015 are treated as equivalent to Assistant Teaching Professor, Associate Teaching Professor and Teaching Professor in 2020 and 2025.
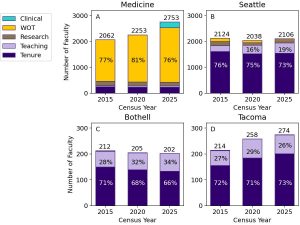
A notable trend in this data is the relative consistency of the proportion of faculty on the tenure track.
On the Seattle campus, there has been a modest decrease in the proportion of faculty on the tenure track, from 76% in 2015 to 75% in 2020 to 73% in 2025 (a shift from 1,609 to 1,527 to 1,547 individuals), with a corresponding increase in the proportion of faculty on the teaching track, from 11% in 2015 (when it was the lecturer track) to 16% in 2020 to 19% in 2025 (a shift from 228 to 329 to 398 individuals).
On the Bothell campus, the decrease in the proportion of faculty on the tenure track has been more significant, from 71% in 2015 to 68% in 2020 to 66% in 2025 (a shift from 150 to 139 to 133 individuals), with a corresponding increase in the proportion of the faculty on the teaching track, from 27% in 2015 to 32% in 2020 to 34% in 2025 (a shift from 60 to 65 to 69 individuals).
On the Tacoma campus, the total faculty population has grown (from 214 in 2015 to 274 in 2025), but the proportion of tenure-track and teaching faculty has stayed roughly constant, with the proportion of faculty on the tenure track shifting from 72% in 2015 to 71% in 2020 to 73% in 2025 (from 155 to 184 to 201 individuals) and the proportion on the teaching track fluctuating from 27% in 2015 to 29% in 2020 to 26% in 2025 (from 57 to 74 to 72 individuals).
At the School of Medicine, where the vast majority of faculty are WOT, the proportion of faculty on the tenure track has seen a moderate decrease, from 12% in 2015 to 10% in 2020 to 9% in 2025 (a shift from 246 to 231 to 230 individuals).
FIGURE 2: 10-YEAR COMPARISON OF DEMOGRAPHIC COMPOSITION BY CAMPUS
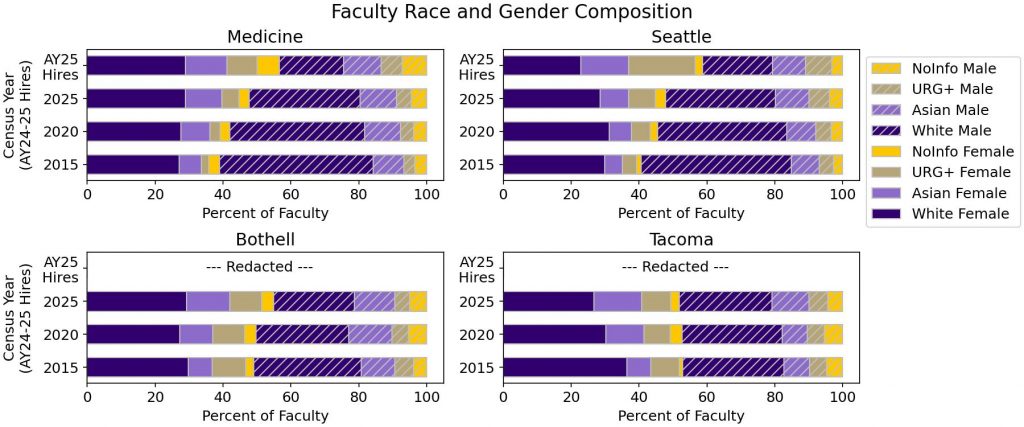
Figure 2 shows the self-reported racial and gender composition of professorial faculty (all tracks) across the University of Washington’s Seattle, Bothell, and Tacoma campuses and the School of Medicine for the years 2015, 2020, and 2025. For the Seattle campus and the School of Medicine, the top bar shows the self-reported racial and gender composition of new professors hired during academic year 2024-25. (Because of small numbers, demographic data are not displayed for new hires at the Bothell and Tacoma campuses.)
A notable trend across the ten-year comparison of demographic data is the decreasing proportion of white male faculty. The trend is most dramatic for the School of Medicine, where the proportion of white male faculty was 45% in 2015, 40% in 2020, and 33% in 2025 (a shift from 931 to 894 to 827 individuals), and where the proportion of white male new hires was 19% in academic year 2024-25 (34 out of 180). The trend is similar for the Seattle campus, where the proportion of white male faculty was 44% in 2015, 38% in 2020, and 32% in 2025 (a shift from 942 to 774 to 675 individuals), and where the proportion of white male new hires was 21% in academic year 2024-25 (19 out of 92). The trend is less dramatic for the Bothell and Tacoma campuses but still evident. At Bothell, the proportion of white male faculty was 32% in 2015, 27% in 2020, and 24% in 2025 (a shift from 67 to 56 to 48 individuals). At Tacoma, the proportion of white male faculty was 30% in 2015, 29% in 2020, and 27% in 2025 (a shift from 64 to 76 to 75 individuals).
Another notable trend is the increasing proportion of female faculty who identify either as Asian or as underrepresented or two or more races. Here, too, the trend is most dramatic for the School of Medicine and for the Seattle campus. In Medicine, the proportion of Asian female faculty was 6% in 2015, 9% in 2020, and 11% in 2025 (a shift from 134 to 192 to 270 individuals). The proportion of URG+ female faculty was 2% in 2015, 3% in 2020, and 5% in 2025 (a shift from 44 to 70 to 128 individuals). At Seattle, the proportion of Asian female faculty was 5% in 2015, 6% in 2020, and 8% in 2025 (a shift from 108 to 132 to 175 individuals). The proportion of URG+ female faculty was 4% in 2015, 5% in 2020, and 8% in 2025 (a shift from 89 to 112 to 164 individuals).
Part of the context for these trends is a small increase in the proportion of male and female faculty who declined to report racial demographic information, from 5.5% of the tri-campus faculty in 2015 to 7.3% in 2025. In Medicine, the proportion of faculty who declined to report increased from about 7% in 2015 to about 8% in 2025. At Seattle, the proportion of faculty who declined to report increased from about 4% in 2015 to about 7% in 2025. At Bothell, the proportion increased from about 6% in 2015 to about 8% in 2025. And at Tacoma, the proportion increased from about 6% in 2015 to about 7% in 2025.
2025 Faculty Composition
Presents detailed racial and gender distributions across campuses, tracks, and ranks, showing rising diversity and continuing variation in representation by unit and faculty category.
2025 Race & Gender Composition
RACE & GENDER
Figure 3 presents the 2025 racial and gender composition of the faculty at the University of Washington in four high-level snapshots: tri-campus overview (Figure 3A), specific campus overview (Figure 3B), professorial track overview (Figure 3C), and professorial rank overview (Figure 3D).
FIGURE 3: 2025 FACULTY DEMOGRAPHIC COMPOSITION
![]() Figure 3A shows the 2025 racial and gender composition of the professorial faculty (all tracks and ranks) across the combined Seattle, Bothell, and Tacoma campuses and the School of Medicine.
Figure 3A shows the 2025 racial and gender composition of the professorial faculty (all tracks and ranks) across the combined Seattle, Bothell, and Tacoma campuses and the School of Medicine.
About 60% of the total faculty identifies as white (3,204 of 5,335), about 21% identifies as Asian (1,107 of 5,335), about 12% identifies as underrepresented or two or more races (626 of 5,335), and about 7% provided no demographic information (398 of 5,335).
The faculty are nearly evenly balanced by gender, with about 49% identifying as female (2,614 of 5,335) and about 51% identifying as male (2,721 of 5,335). Faculty who identify as white and male are a slightly larger proportion of the total faculty (about 31%) compared to those who identify as white and female (about 29%). Faculty who identify as Asian and male are the same proportion of the total faculty as those who identify as Asian and female (each about 10%). And faculty who identify as URG+ and male are a slightly smaller proportion of the total faculty (about 5%) than those who identify as URG+ and female (about 7%).
Figure 3B shows the 2025 racial and gender composition of the professorial faculty (all tracks and ranks) at the School of Medicine and the Seattle, Bothell, and Tacoma campuses.
The proportion of faculty who identify as white is consistent across the School of Medicine and the Seattle campus at about 61% (1,667 of 2,753 at Medicine and 1,282 of 2,106 at Seattle). The proportion of faculty who identify as white is notably smaller at the Bothell and Tacoma campuses, but similarly consistent, about 53% at Bothell (107 of 202) and about 54% at Tacoma (148 of 274). The proportion of faculty who identify as white and female is consistent across Medicine, Seattle, and Bothell (about 29%) but somewhat smaller at Tacoma (about 27%). The proportion of faculty who identify as white and male is similar at Seattle and Medicine (about 32% and 33%, respectively), but notably smaller at Bothell (about 24%) and Tacoma (about 27%).
The proportion of faculty who identify as Asian is consistent across the Bothell and Tacoma campuses at about 25% (50 of 202 at Bothell and 69 of 274 at Tacoma), but somewhat smaller at Medicine at 22% (604 of 2,753) and Seattle at about 18% (384 of 2,106). The proportion of faculty who identify as Asian and female is similar at Bothell (about 13%) and Tacoma (about 14%) but somewhat smaller at Medicine (about 12%) and notably smaller at Seattle (about 8%). The proportion of faculty who identify as Asian and male is relatively consistent across all campuses, about 10% at Medicine and Seattle, about 12% at Bothell, and about 11% at Tacoma.
The proportion of faculty who identify as underrepresented or two or more races is consistent across the Seattle, Bothell, and Tacoma campuses at about 14% (295 of 2,106 at Seattle, 28 of 202 at Bothell, and 38 of 274 at Tacoma) but smaller at the School of Medicine at about 10% (265 of 2,753). The proportion of faculty who identify as URG+ and female is consistently larger than the proportion who identify as URG+ and male. The URG+ gender ratio is about 5% female compared to about 4% male at Medicine, about 8% female compared to about 6% male at Seattle, about 9% female compared to about 4% male at Bothell, and about 8% female compared to about 5% male at Tacoma.
Figure 3C shows the 2025 racial and gender composition of the five professorial tracks (all campuses and ranks). Trends are evident both within specific tracks and within specific demographic categories.
Faculty who identify as white are the largest proportion of each professorial track: about 59% of the tenure track (1,243 of 2,111), about 64% of the teaching track (378 of 591), about 64% of the research track (144 of 224), about 61% of the WOT track (1,320 of 2,164), and about 49% of the new clinical practice track (119 of 245). Faculty who identify as white and female are the largest proportion of the teaching and clinical practice tracks, about 37% of the teaching track (compared to about 27% who identify as white and male) and about 28% of the clinical practice track (compared to about 20% who identify as white and male). Faculty who identify as white and male are the largest proportion of the tenure, research, and WOT tracks, about 33% of the tenure track (compared to about 26% who identify as white and female), about 34% of the research track (compared to about 30% who identify as white and female), and about 32% of the WOT track (compared to about 29% who identify as white and female).
Faculty members who identify as Asian are about 28% of the total clinical practice track (68 of 245); however, those who identify as Asian and female are about 20% of this total (50 of 245), whereas those who identify as Asian and male are only about 7% (18 of 245). In contrast, faculty who identify as Asian are about 22% of the total WOT track (474 of 2,164), but there is greater parity by gender, with those who identify as Asian and female slightly over 11% of the WOT total (245 of 2,164) and those who identify as Asian and male slightly under 11% of the WOT total (229 of 2,164).
Faculty who identify as underrepresented or two or more races are the smallest proportion of each track: about 14% of the tenure track (294 of 2,111), about 14% of the teaching track (82 of 591), about 9% of the research track (21 of 224), about 9% of the WOT track (196 of 2,164), and about 13% of the clinical practice track (33 of 245). Those who identify as URG+ and female are a slightly larger proportion of each track compared to those who identify as URG+ and male, with the exception of the research track, where there is relative parity by gender, with those who identify as URG+ and female about 4% of the research total (10 of 224) and those who identify as URG+ and male about 5% of the research total (11 of 224).
Figure 3D shows the 2025 racial and gender composition of the three professorial ranks (all tracks) across the combined Seattle, Bothell, and Tacoma campuses and the School of Medicine.
Of the total faculty, about 29% are assistant professors (1,522 of 5,335), about 30% are associate professors (1,617 of 5,335), and about 41% are full professors (2,196 of 5,335).
Faculty who identify as white are the largest proportion of each professorial rank: about 47% of assistant professors (712 of 1,522), about 61% of associate professors (994 of 1,617), and about 68% of full professors (1,498 of 2,196). Those who identify as white and female are a notably larger proportion of assistant professors than those who identify as white and male (about 28% compared to about 19%); they are about the same proportion of associate professors as those who identify as white and male (about 32% compared to about 30%); but they are a notably smaller proportion of full professors (about 27% compared to about 41%).
Faculty who identify as Asian are about 25% of total assistant professors (386 of 1,522), about 20% of total associate professors (319 of 1,617), and about 18% of total full professors (402 of 2,196). The proportion of those who identify as Asian and female steadily decreases across ranks, from about 14% of assistant professors to about 11% of associate professors to about 7% of full professors. The proportion of those who identify as Asian and male, however, is more consistent across ranks: about 11% of assistant professors, about 9% of associate professors, and about 11% of full professors.
Faculty who identify as underrepresented or two or more races are about 16% of total assistant professors (250 of 1,522), about 11% of total associate professors (185 of 1,617), and about 9% of total full professors (191 of 2,196). The proportion of those who identify as URG+ and female steadily decreases across ranks, from about 10% of assistant professors to about 6% of associate professors to about 5% of full professors. The proportion of those who identify as URG+ and male similarly decreases across ranks, from about 7% of assistant professors to about 5% of associate professors to about 4% of full professors.
These data also show an upward trend in the proportion of faculty who provide no demographic information. While about 5% of full professors provided no demographic information (105 of 2,196) and about 7% of associate professors provided no demographic information (119 of 1,617), about 11% of assistant professors provided no demographic information (174 of 1,522).
2025 Age Composition
Analyzes faculty age across campuses, tracks, and ranks, revealing a predominantly mid‑career workforce and younger profiles within the clinical practice and assistant professor cohorts.
2025 Age Composition
AGE
FIGURE 4: 2025 COMBINED FACULTY AGE COMPOSITION
![]()
As shown in Figure 4A , the largest proportions of faculty fall within the 35-44 and 45–54 age categories, with noticeably small proportions of faculty in the under 35 or over 65 categories.
The age composition of tri-campus faculty reflects a workforce with a broad range of experience levels. Faculty members under the age of 35 comprise just 5% (n=282) of the total. The largest proportion of faculty, 32% (n=1,696), are between the ages of 35–44, followed closely by those in the 45–54 age group, who make up 30% (n=1,599). Faculty aged 55–64 represent 21% (n=1,117) of the population, while individuals over 65 years old account for 12% (n=640).
Figure 4B reveals distinct patterns, with the largest groups consistently falling within the 35–54 range.
At Bothell, 39% of faculty are aged 45–54, and 26% are aged 35–44, while only 4% are under 35 and 8% are 65 or older, with 22% in the 55–64 age group. Medicine has the highest concentration of faculty aged 35–44 at 38%, followed by 29% aged 45–54, 17% aged 55–64, 9% aged 65 or older, and 7% under 35. Seattle presents a more even distribution, with 28% in the 35–44 age group, 28% aged 45–54, 23% aged 55–64, 14% aged 65 or older, and 8% under 35. Tacoma shows a similar pattern, with 32% aged 35–44, 34% aged 45–54, 19% aged 55–64, 10% aged 65 or older, and 5% under 35. These figures highlight that faculty aged 35–54 constitute the majority at every campus, while those under 35 and 65 or older represent the smallest proportions.
Figure 4C shows several notable patterns. For the Clinical Practice track, the 35–44 age group is the largest, representing 49% of the total, while those under 35 account for 14% and those 65 or older represent 4%. In the Research track, the population is more evenly distributed, with faculty aged 45–54 representing 27% and those 65 or older accounting for a relatively high 15%. The Teaching track has its largest share in the 45–54 age group (34%), while faculty under 35 represent 8% and those 65 or older represent 9%. In the Tenure track, faculty aged 35–44 and 45–54 each represent approximately 27%, together comprising more than half of the total, while those 65 or older account for 15%. The WOT track also sees its largest percentage in the 35–44 age group (36%), with the proportion gradually decreasing in older age groups. Across all professorial tracks, faculty under 35 and 65 or older represent smaller percentages, while those aged 35–54 constitute the majority. These patterns indicate a faculty workforce concentrated in mid-career phases across all professorial tracks.
Figure 4D reveals a clear pattern, as expected. Among assistant professors, 19% fall under the less than 35 age group, and 68% are in the 35-44 age group, while only 3% are aged 55 or older. For associate professors, the largest proportion falls in the 45–54 age category (43%), followed by those aged 35–44 (35%), with smaller percentages in younger and older groups. The full professor rank is predominantly composed of faculty aged 45–54 (31%), 55–64 (33%), and 65 or older (22%), with less than 1% under 35. Overall, the assistant professor rank comprises predominantly younger faculty, the associate professor rank is centered in mid-career ages, and the full professor rank consists mostly of faculty aged 45 and older, reflecting a progression in rank associated with increasing age and experience.
Hires and Separations
Summarizes annual hiring, resignations, and retirements, noting reduced hiring, increased separations, and significant shifts driven by the new clinical practice track.
Hires and Separations
HIRING, RESIGNATIONS & RETIREMENTS
The evolution of the faculty composition over time results from the balance of new hires with resignations and retirements. Table 1 compares the number and percentage of faculty who were hired, resigned, or retired between November 2024 and October 2025 (AY 25) to the previous three-year period. Between November 2021 and October 2024 (AY 22–AY 24), an average of 3.2% of the faculty resigned each year, while 2.0% retired. The total faculty grew over this time window, with approximately 8% of the faculty joining each year.
Comparison of the previous three years to AY 25 is complicated by the addition of the clinical practice track, as discussed above. The table entries for AY 25 thus separate the new clinical practice faculty as well as those resigning professorial positions to move into the new track. The data show that instead of the net growth of 132 faculty (2.7%) per year during AY 22-24, tri-campus separations were nearly equal to new hires in AY 25. This is due both to a significant (23%) decrease in the annual number of new hires over recent years and a significant (17%) increase in separations.
TABLE 1: PROFESSORIAL FACULTY TURNOVER
Faculty Subset |
AY25 |
Average (AY 22-AY 24) |
| Total Faculty | 5,090 + 245 clinical | 4,990 |
| New Hires | 300 (5.6%) + 242 clinical | 390 (7.8%). |
| Resignations | 172 (3.4%) + 15 to clinical | 157 (3.2%) |
| Retirements | 130 (2.5%) | 101 (2.0%) |
Table 1. Annualized Recent Faculty Turnover. AY25 refers to the 2025 Census for total faculty and the difference between the 2024 and 2025 censuses for hires and separations. Average AY 22-AY 24 total faculty is the average of the 2022, 2023, and 2024 census totals; Average AY 22-AY 24 hires and separations are one-third the total of hires and separations between November 2021 and October 2024. 2025 percentages of new hires, resignations, and retirements are calculated omitting clinical practice hires as well as faculty who resigned professorial appointments to join the clinical practice track.
FIGURE 5: HIRES AND SEPARATIONS BY UNIT*
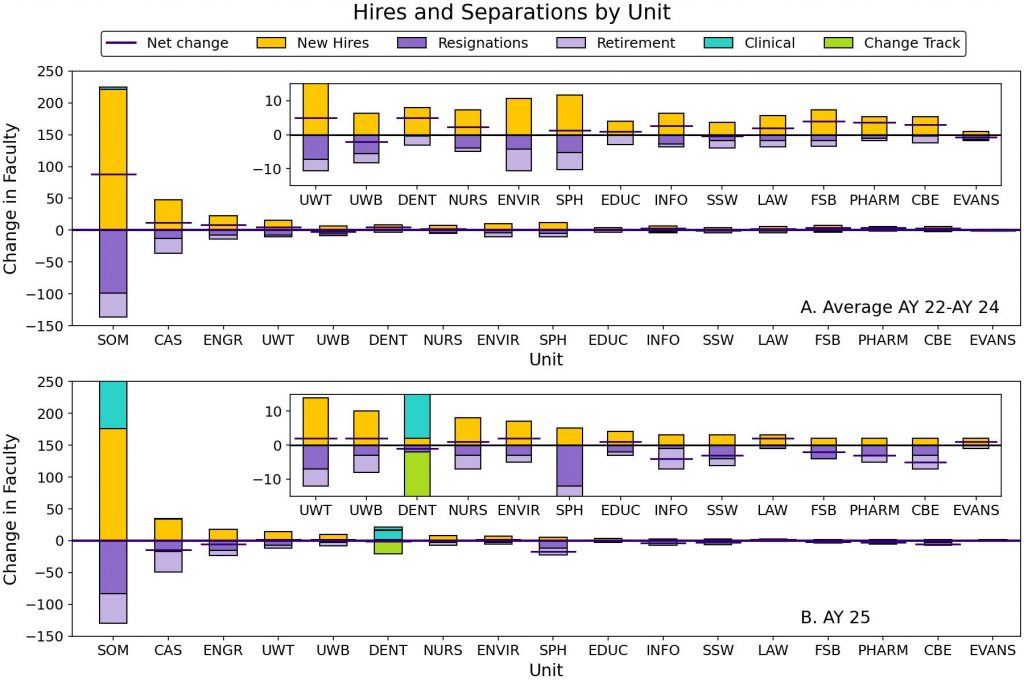
The addition and subtraction of faculty positions occur at the unit level. Figure 5 depicts hires and separations by academic unit (separating clinical practice in blue and green). The figure details the individual colleges comprising the Seattle campus as well as the campuses of Medicine (SOM), Bothell (UWB), and Tacoma (UWT). The insets display the same data with an expanded vertical scale. The large turnover in the School of Dentistry (DENT) is due to 15 individuals resigning from existing professorial tracks to join the new clinical practice track. Including the clinical practice faculty, the number of new professorial faculty in Medicine during AY 25 is 403 (exceeding the scale).
Except for Medicine, Arts & Sciences (CAS), and Engineering (ENGR), most units have a turnover of fewer than 10 faculty per year, and one-third of units hire fewer than 5.
The figure highlights a major shift in the past year from only 3 units with net faculty loss in AY 22–24 (totaling 9 faculty) to more than half of units experiencing net faculty loss in AY 25. The shift is particularly acute in the School of Public Health (SPH), which had approximately 15% (22 individuals) of their faculty either resign (12) or retire (10) in the past year. This is more than twice their recent averages of 5.3 and 5 individuals, respectively. SPH also hired new faculty at a rate less than half their recent average (5 vs 11.7). The net change in the number of faculty in SOM in AY 25 excluding the clinical practice track is a gain of 41 faculty, less than half the average gain of 95 faculty per year in AY 22 – AY 24, primarily due to 45 fewer new hires. Most other units also saw both decreases in hiring and increases in separations in AY 25 relative to the previous three years.
*School, College, Campus abbreviations and 2025 population: SOM = Medicine (2,760); CAS = Arts and Sciences (856); ENGR = Engineering (335); UWT = Tacoma (276); UWB = Bothell (202); DENT = Dentistry (65); NURS = Nursing (70); ENVIR = Environment (151); SPH = Public Health (146); EDUC = Education (73); INFO = Information (62); SSW = Social Work (45); LAW = Law (54); FSB = Business (121); PHARM = Pharmacy (51); CBE = Built Environments (65), EVANS = Public Policy & Governance (30). Note that faculty with joint appointments in different schools and colleges are counted in each unit for the school-disaggregated counts.
New Hires
Details demographic and age patterns of AY 2025 new hires, showing alignment with assistant professor trends and younger age distributions compared with the overall faculty.
New Hire Demographic and Age Composition
TABLE 2: NEW HIRES AND SEPARATIONS BY RANK AND TRACK IN AY 25
![]() Table 2 summarizes the hires and separations from the University in the past year by rank and track. Consistent with the Provost’s hiring plan policy that at least 80% of new hires should be at the entry level, 83% of new hires are at the rank of assistant professor. We also find that 79% of retirements (50% of separations) are from the rank of full professor. Resignations are most common at the rank of assistant professor (approximately 25% of clock-managed faculty resign prior to being considered for promotion), although within the tenure track half the resignations are at the rank of full professor. In the past year, there was a net loss of faculty members in the tenure, teaching, and research tracks, while the WOT track grew, but not enough to offset that loss. The clinical practice track is expected to continue to grow over the next few years as annually appointed clinical faculty who resign or retire are replaced within this track; it is not known what percentage of new clinically-focused faculty will be in the new clinical practice track as opposed to the WOT track.
Table 2 summarizes the hires and separations from the University in the past year by rank and track. Consistent with the Provost’s hiring plan policy that at least 80% of new hires should be at the entry level, 83% of new hires are at the rank of assistant professor. We also find that 79% of retirements (50% of separations) are from the rank of full professor. Resignations are most common at the rank of assistant professor (approximately 25% of clock-managed faculty resign prior to being considered for promotion), although within the tenure track half the resignations are at the rank of full professor. In the past year, there was a net loss of faculty members in the tenure, teaching, and research tracks, while the WOT track grew, but not enough to offset that loss. The clinical practice track is expected to continue to grow over the next few years as annually appointed clinical faculty who resign or retire are replaced within this track; it is not known what percentage of new clinically-focused faculty will be in the new clinical practice track as opposed to the WOT track.
FIGURE 6: 2025 NEW HIRE DEMOGRAPHIC AND AGE COMPOSITION
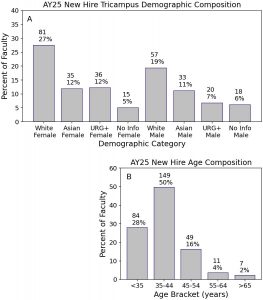
Figure 6 shows the tri-campus demographic (6A) and age (6B) composition of the most recent faculty hires (not including clinical practice track) for comparison with Figures 3 and 4 for the entire faculty population. The data in Figure 6A are disaggregated by campus for Medicine and Seattle in the top bars in Figures 2A and 2B.
Newly hired faculty have a demographic composition similar to that of assistant professors, with the percentage of faculty in each of the eight categories being within 2% for the two groups. Since most of the new hires (83%) are assistant professors, this is the most relevant comparison. These new assistant professors comprise only 16% of the total assistant professors, indicating a stable population composition among assistant professors. As shown by comparing the bars in Figures 2A and 2B, the new hires contribute to a slow evolution of the faculty distribution toward fewer white males and more women and people of color.
Newly hired faculty are much younger than the average faculty member, with 28% under 35 and more than 75% under 45.
International Scholars
Reports countries and regions of origin for UW‑sponsored visa holders, emphasizing UW’s global reach and the concentration of international scholars in tenure and WOT tracks.
International Scholars
FIGURE 7: 2025 INTERNATIONAL SCHOLAR POPULATION
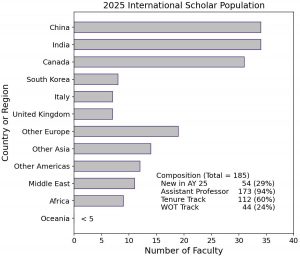
The University of Washington’s faculty reflects its position as a world-class university, attracting scholars from all over the world. When faculty first arrive at the University, those without either US citizenship or permanent residency require a visa until they can acquire either citizenship or residency. The typical period of visa sponsorship is 2–3 years, but the period can be much longer if there is a large backlog at the Department of State, especially for scholars from India and China, or shorter if the scholar has already started the process of obtaining permanent residency before joining the University.
Data regarding international scholars are only available for faculty who were sponsored for a visa by the University, and thus the data on all international scholars are inherently incomplete. The University does not track citizenship or national origin as a field in Workday. The International Scholars Office within Academic Personnel & Faculty only tracks data on the sponsorship process: there are faculty who are on visas not sponsored by the University (e.g., through their spouse) who are not reflected in data within Academic Personnel & Faculty (APF). There also are faculty in the dataset who obtained permanent residency through independent counsel prior to the expiration of their University-sponsored visa but who are no longer on that visa.
Figure 7 shows the country or region of origin of the 185 professorial faculty with valid University-sponsored visas in October 2025. Of these, 54 (29%) were processed between November 2024 and October 2025. There is not a direct correlation to new hires, as visa processing dates are not identical to start dates, but these faculty represent approximately 15% of the annual total of new faculty. New faculty requiring visas are most likely to be in the tenure (60%) and WOT (24%) tracks and are overwhelmingly at the rank of assistant professor (94%).
There are 6 countries with 5 or more international scholar faculty: China, India, Canada, South Korea, Italy, and the United Kingdom. These comprise the home countries of approximately two-thirds of the University’s international scholars. The remaining 64 international faculty are from 39 other countries. They are grouped by region in Figure 7.
Faculty Hiring Process
Describes the multi‑stage faculty recruitment cycle, from planning through approval and search activity, emphasizing alignment with budget processes and institutional hiring expectations.
Faculty Hiring Process
SCOPE & DATA PARAMETERS
This report’s applicant journey data focuses only on non-clinically based professorial ranks and tracks with active recruitments during the 2024–25 Academic Year. Within the School of Medicine, about half (1,082 of 2,033) of WOT track faculty have a primary clinical focus, about a third (700 of 2,033) have a primary research focus, and the remainder (251) have no specific primary focus, but rather combine clinical, research, and teaching activities. The clinically focused positions are not tied to the academic year and, because patient care requires rapid filling of vacancies, these are generally not included in the annual hiring plan process.
SEARCH PROCESS
The faculty search process at top-tier research universities like the University of Washington is deliberately thorough and often spans more than an entire academic year. Hiring a new professor is one of the most consequential decisions a unit makes, as it involves selecting a long-term intellectual partner. The process begins with months of internal planning and administrative approvals before a position is advertised (typically in summer or fall), followed by a lengthy application period that can attract hundreds of highly qualified applicants from national and international pools. Search committees then spend weeks or months reviewing applications and conducting multiple rounds of interviews, culminating in on-campus visits where finalists deliver talks, meet faculty and students, and undergo comprehensive evaluation. Each stage involves careful deliberation, consensus-building, and intensive negotiation over salary, resources such as lab space, and occasionally partner (spousal) employment, while ensuring fairness and transparency. The sheer volume of applicants for some positions, the need for departmental consensus, and the complexity of negotiations extend the process over many months, with the aim of hiring a colleague who will shape the University’s research, teaching, public service, and reputation for decades to come. In previous years, departmental hiring plans for the academic year were submitted over the summer and approved by September 1. However, since faculty compensation is a very large component of most departmental budgets, the Provost instituted a change in the past year to align unit submissions related to faculty hiring with those for the overall budget.
HIRING CYCLES
The faculty hiring process now occurs on an annual cycle that intersects with the annual budget development cycle. Each December, schools, colleges, and campuses assess their instructional needs and submit a proposal (Hiring Plan) outlining the faculty positions they intend to hire in the next hiring cycle. This proposal is reviewed by the Office of Finance, Planning & Budgeting, the Office for Academic Personnel & Faculty, and the Provost. Once hiring plans are approved in April, academic units may initiate faculty searches in the Interfolio applicant tracking system and engage in hiring activity. At the end of the hiring cycle the following winter, academic units submit a report on the outcome of each approved position, noting whether a successful hire was made or whether they plan to fill the position in the next hiring cycle (known as a carry forward). Since most academic positions are posted in the summer or fall and filled in winter or spring, a large fraction of the searches approved (in August 2024) for the 2024–25 academic year were still open when the 2025–26 hiring plans were submitted. Due to the budget uncertainties that developed as the 2025–26 hiring plans were reviewed, the number of new searches requested and approved for 2025–26 is lower than for 2024–25; we predict that separations will exceed new hires this year in almost all units.
HIRING PLAN PROCESS
The hiring plan process was developed to help academic units strategize their overall faculty composition based on their strategic goals and academic motivations. Each requested position is discussed in relation to instructional and programmatic needs. Units are also asked to justify any requests for a hire at the senior level and to aim for at least 80% of the hires to be at the rank of assistant professor. Overall, the process provides the Provost, the Office for Academic Personnel & Faculty, and the Office of Finance, Planning & Budgeting with an opportunity to assess the faculty hiring strategies of each unit through a standardized mechanism.
Tenure, Promotion & Retention
Outlines promotion outcomes, clock‑managed timelines, and long‑term retention patterns, highlighting strong promotion success and effective competitive and preemptive retention efforts.
Tenure, Promotion, and Retention
TENURE AND PROMOTION SUCCESS RATES
Promotion of a faculty member from assistant professor to associate professor or from associate professor to professor is a key moment in their professional development. Last year, 351 professorial faculty were promoted, including 58 who were awarded tenure. This major undertaking, which occurs every year, involves thousands of people. Staff in over 150 offices across departments, schools, colleges, campuses, and tri-campus units played essential roles at every stage of the process: collecting, collating, and transmitting information, communicating with both candidates and reviewers, and helping to ensure correct processes were followed. Over 15,000 votes were cast by faculty, informed by carefully researched subcommittee reports and thoughtful reviews by external colleagues from peer institutions, with subsequent thorough consideration conducted by numerous elected faculty councils. Reasoned case summaries and recommendations were made by chairs, directors, deans, chancellors, and APF leadership. Each of these played an essential role in providing the provost with the information needed to understand the faculty and make a thoughtful, fair decision on each case.
In addition to promotions of professorial faculty (and librarians) that route through the Provost’s office, a total of 381 clinical and affiliate faculty members were promoted in July 2025 in 58 appointing units spread among 9 schools and colleges. This year marked a significant change in the process for promotion of these annually appointed clinical and affiliate faculty: their promotions formerly followed the same path as professorial faculty; however, starting in AY 2024–25, the Provost delegated authority to deans and chancellors to allow a rank change upon reappointment. This change went smoothly while also dramatically reducing administrative burden at the tri-campus level.
TABLE 3: 2024-25 APPROVED PROMOTIONS AND RANK CHANGE ON REAPPOINTMENT
![]()
The data in Table 3 show academic personnel and faculty who successfully applied for promotion and tenure by track and rank. Table 3 also provides data for clinical and affiliate faculty.
Assistant professors in the tenure, WOT, and research tracks are clock-managed, which means they have a set time by which they must either meet the standards for promotion to associate professor or leave the ranks of professorial faculty. If there are no extenuating circumstances, this timeline is 6 years. Assistant professors were able to obtain up to 2 years’ extension of this timeline (known as a clock waiver) for the interruption of the COVID-19 pandemic in addition to waivers for more traditional reasons such as the birth of a child or research delays beyond their control. Faculty members whose mandatory review year is 2026 or 2027 are also eligible for an additional year due to the sudden changes in the federal research support landscape in 2025.
*Librarians from Assistant Librarian to Senior Assistant Librarian; annual faculty from Instructor to Assistant Professor.
FIGURE 8: CLOCK-MANAGED FACULTY RETENTION AND PROMOTION STATUS
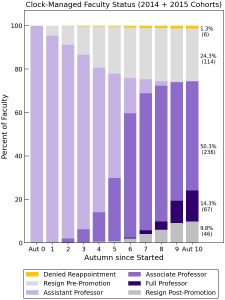
The University of Washington hires assistant professors with the expectation that they are capable of earning promotion, and they are overwhelmingly successful at doing so. Figure 8 shows the annual retention and promotion status of the 436 faculty who joined the University in 2014 and 2015 as clock-managed assistant professors. Only 6 (1%) of these faculty were denied reappointment, either after their initial 3-year term or when they were reviewed for promotion to associate professor. Approximately 20% had at least one clock waiver postponing their mandatory review. Many assistant professors are promoted before their mandatory review; approximately 50% of these held assistant professor positions at another university before joining the University of Washington.
Assistant professors resign at a roughly constant rate over their first few years, and the rate decreases as they approach promotion review, with approximately 25% leaving before promotion. After promotion, faculty resignations continue at a lower rate, so that overall, approximately one third of new assistant professors have left the University after 10 years. Many of these faculty were recruited away from UW by internationally known institutions. Those most likely to leave are those whose University of Washington assistant professor position is their first job after receiving their doctoral degree (45% left pre-promotion, 55% had left within 10 years), roughly twice the rate of those who held an external fellow or postdoctoral position first (22% pre-promotion, 27% within 10 years). Those least likely to leave within 10 years of hire are those who received at least one clock waiver (only 15% left pre-promotion, 26% within 10 years) or who were in faculty positions elsewhere before coming to UW (9% left pre-promotion, 20% within 10 years). Of those who stay at the University, approximately one quarter have been promoted to full professor within 10 years.
FACULTY RETENTIONS
The University of Washington employs several faculty retention strategies, including preemptive, competitive, and A/B salary retention adjustments, all governed by Executive Order No. 64 and the Faculty Code, Chapter 24. These policies authorize the use of salary increases to retain meritorious faculty, either proactively to prevent departure or in response to competitive external offers.
Competitive retention adjustments are specifically implemented when a faculty member has received or is likely to receive an offer from another institution, while A/B salary retention allows for adjustments in the ratio of guaranteed to additional compensation as a retention strategy. All retention actions require Provost approval and follow consultative processes established at the unit level, ensuring that the University can effectively attract and retain distinguished faculty members.
FIGURE 9: FACULTY RETENTION
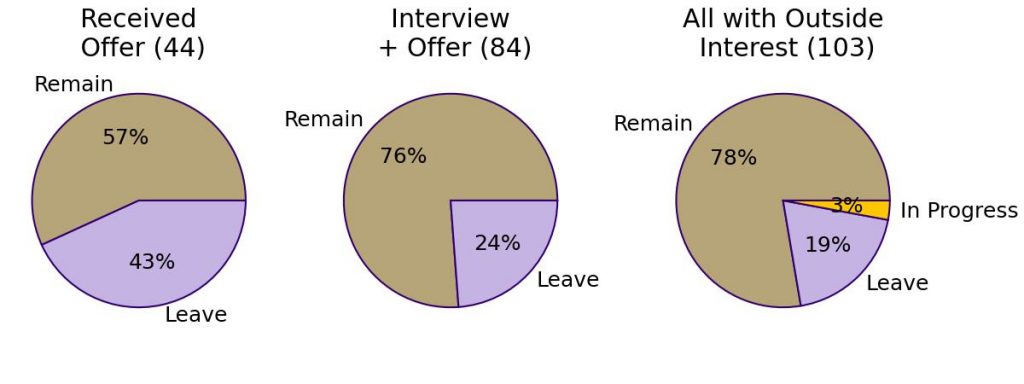
As a result of legislation passed by the Faculty Senate in 2024, deans and chancellors are now required to make an annual report on all retention requests, whether successful or unsuccessful. The first such reports were submitted this summer and are summarized here.
As detailed in Figure 9, unit leaders reported 103 cases where an individual faculty member reported external recruitment from one or more specific institutions. Of these, 84 progressed to at least the application and interview stage, and 44 to the point of a verbal or written offer. Of these 103 cases, units declined to respond with a counteroffer in 6 cases, in each instance because of lack of resources. Preemptive retention was quite successful, preventing more than 57% from progressing to the offer stage. Of those who received an outside offer and requested a retention counteroffer from the University, 57% chose to
remain at the University. Overall, only 20 of the 103 ultimately left.
Comparison to the separations data shows that the 20 faculty members who left despite a retention counteroffer represent only 11% of those who resigned in AY 25. Limited data are available regarding the other 167 faculty who resigned.
Of the faculty who did receive retention counteroffers, the average salary adjustment offered was the same (13%) for those who did or did not leave. Similarly, non-salary components such as research support, summer salary, or other factors were involved in approximately 30% of both successful and unsuccessful retention packages.